
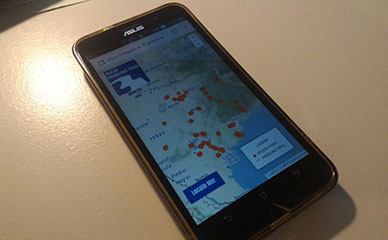
This map was created to explore and locate offical Texas Paddling Trails. The map was designed for the moblile experience with pinch and zoom functionality and features a geolocation feature for finding trails near the user's current location.
This map was generated importing access points into QGIS, then digitizing individual trails. Data was then pushed to Carto, and pulled down into a Leaflet map.
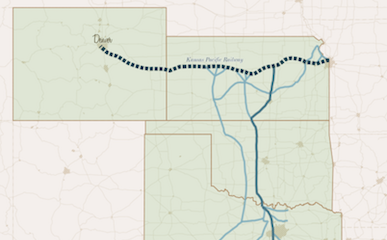
This interactive map was created to let users experience the most complete map of the Chisholm Cattle Trail available. Users can look at trail names, starting, and ending locations (when available) by hovering the cursor over trails.
This map was created by georeferencing the map The Old Chisholm Cattle Trail with Subsidiary Trails in Texas 1873 in QGIS, then digitizing individual trails. Data was then uploaded to Carto, and used to produce the final Leaflet map.
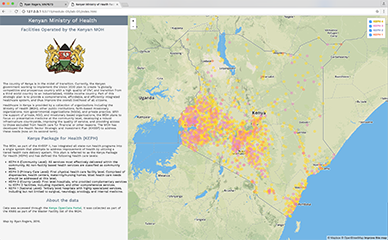
This interactive map represents health care facilities operated by the Kenyan Ministry of Health. Different facility levels are represented with different selectable layers. Information about each facility can be obtained by hovering over each marker.
This map was created from data imported from the Kenyan Open Data Portal, using Mapbox.